Imagine you're staring at a chart. The candles are flashing green, and the price is climbing steadily. Most people would tell you to buy. But then you check the VIX Index is plummeting, and almost every retail trader is already long. Does that mean the trend is strong, or are you walking right into a "bull trap"? This is the eternal tug-of-war between Market Sentiment and Price Action.
One tells you how people feel, while the other tells you what they're actually doing. If you only follow the feeling, you might get swept away by a crowd moving in the wrong direction. If you only follow the price, you might miss the "why" behind a sudden crash. To survive in the markets, you need to know when to trust the chart and when to listen to the crowd.
The Basics: Psychology vs. Evidence
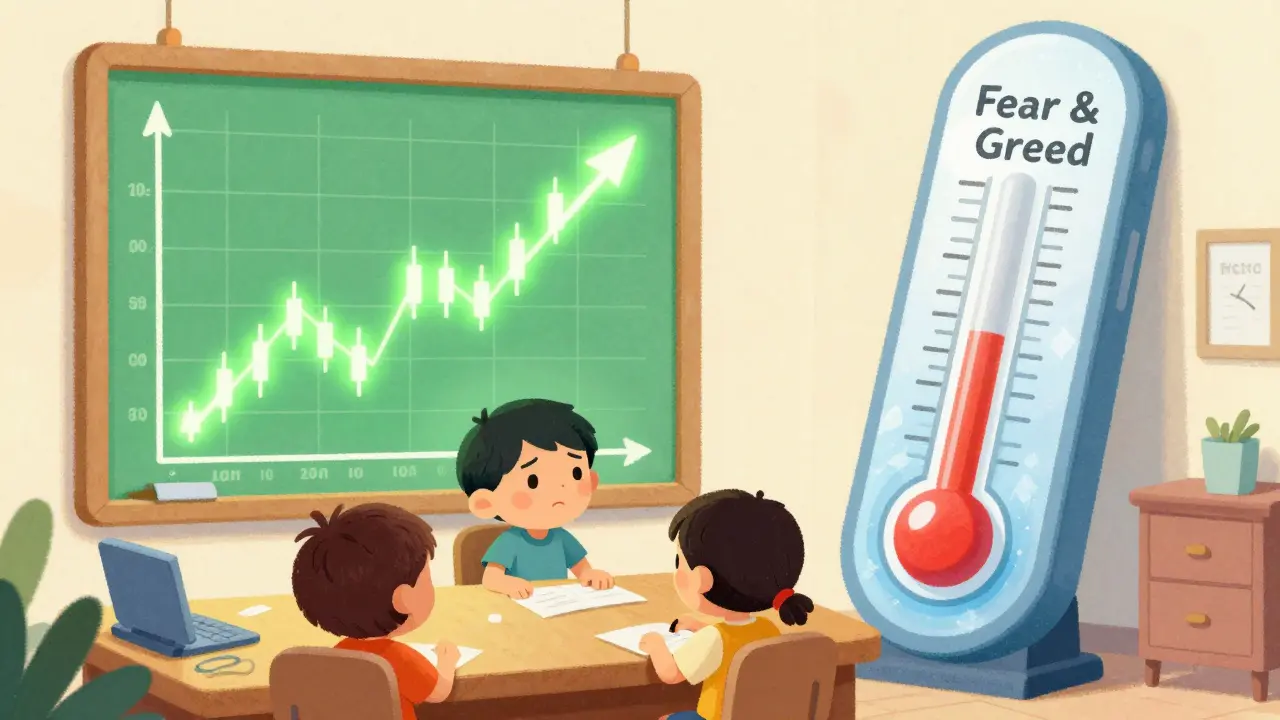
Market Sentiment is essentially the collective mood of the trading world. It's the emotional footprint of the market. Think of it as a thermometer that measures fear and greed. When sentiment is "extreme," it often acts as a contrarian signal. For instance, when everyone is terrified, that's often exactly when the smartest money starts buying.
On the flip side, Price Action is the objective study of price movement. It doesn't care about news, tweets, or feelings. It focuses on the historical footprints left by buyers and sellers on a chart. If a price hits a specific level and bounces back three times, that's a fact, regardless of whether the sentiment is bullish or bearish.
While sentiment analysis often requires external data feeds, price action only requires a clean chart. This makes price action the go-to for retail traders, while institutional players-like hedge funds-rely heavily on sentiment metrics to gauge where the "dumb money" is positioned.
Tools of the Trade: How to Measure Both
You can't just "guess" sentiment; you need numbers. Professionals use a few key instruments to quantify the mood of the market. The CBOE Volatility Index (VIX) is the most famous, where a reading above 30 usually screams "extreme fear." Then there are Commitment of Traders (COT) reports, which reveal how commercial hedgers are positioned compared to speculators. If the big banks are buying while the retail crowd is selling, the sentiment is skewed, and a reversal is likely.
Price action traders use a different toolkit. Instead of indices, they look for specific shapes and behaviors in the candles. A Pin Bar, for example, shows a quick rejection of a price level, signaling a potential turn. Other staples include Inside Bars for volatility consolidation and the classic "Head and Shoulders" pattern to spot the end of a trend.
| Feature | Market Sentiment | Price Action |
|---|---|---|
| Core Focus | Trader Psychology (Fear/Greed) | Price Movement (Charts) |
| Primary Tools | VIX, COT Reports, Put/Call Ratio | Pin Bars, Trendlines, Support/Resistance |
| Main Advantage | Spots Contrarian Extremes | Precise Entry/Exit Levels |
| Biggest Weakness | Can be lagging or manipulated | Highly subjective interpretation |
| Best Environment | Major News/Macro Events | Trending or Consolidation Phases |
When to Trust Sentiment Over Price
There are times when the chart is lying to you. During major macroeconomic events-like a Federal Reserve interest rate announcement-price action often goes haywire. You'll see "wicks" shooting in both directions, and traditional patterns break down. In these moments, sentiment analysis often outperforms pure price action by over 20% because it captures the systemic shock and the collective reaction of the big players.
Sentiment is also your best friend when the market hits an extreme. If the VIX is spiking above 35, history shows a high success rate for contrarian trades. When the crowd is in a total panic, the price might still be falling, but the sentiment tells you that the selling is exhausted. This is where you find those legendary "bottom-fishing" opportunities.

When Price Action Takes the Lead
If sentiment is the "weather forecast," price action is the "actual rain." When the market is in a steady trend or a boring consolidation phase, sentiment indicators often flatline or provide vague signals. This is where price action shines. By identifying a strong trendline or a clear support zone, you can enter trades with a much tighter stop-loss and a better risk-to-reward ratio.
For example, if you see a price consistently respecting a rising trendline, you don't need to know if the world is feeling optimistic. You just need to know that buyers are stepping in at that specific price point. In forex markets specifically, price action tends to be more reliable than sentiment because the currency pairs are influenced by a complex web of global flows that a single sentiment index can't capture.
The Hybrid Approach: The Professional's Secret
The most successful traders don't choose one or the other. They use sentiment as a filter and price action as the trigger. Think of it this way: sentiment tells you what to do (Buy or Sell), and price action tells you when to do it (the exact entry point).
A typical professional workflow looks like this: First, check the COT reports or VIX to see if the market is at an extreme. If the sentiment is extremely bearish, the trader looks for a reason to buy. Then, they move to the chart and wait for a price action signal-like a bullish engulfing pattern or a pin bar at a major support level. By combining the two, you avoid the "fake-outs" that plague traders who only use one method.
Data backs this up. Studies show that combining sentiment extremes with price action reversals can significantly boost annual returns compared to using either in isolation. It's the difference between guessing based on a feeling and executing based on a confirmed pattern.
Pitfalls and Common Mistakes
The biggest danger in sentiment analysis is the "echo chamber." In the era of social media, sentiment can be easily manipulated. Remember the GameStop squeeze of 2021? Retail traders deliberately skewed sentiment indicators to trap institutional shorts. If you rely solely on what "everyone" is saying on Reddit or Twitter, you're not analyzing sentiment-you're just following a crowd.
Price action has its own trap: subjectivity. Two traders can look at the same chart and see two different things. One sees a "head and shoulders" top; the other sees a "bull flag." This is why price action requires a level of discipline and thousands of hours of chart time to master. Without a strict set of rules, you're just drawing shapes that confirm your existing bias.
Which is easier for a beginner to learn?
Price action is generally more accessible because you don't need expensive data subscriptions-just a chart. However, it takes longer to master (often 9-12 months) because pattern recognition is a skill developed through experience. Sentiment analysis can be learned faster (6-9 months) but requires you to understand behavioral finance and macroeconomic indicators.
Can I use sentiment analysis for day trading?
Yes, but with caution. High-frequency sentiment tools (like NLP-based news scanners) are great for day trading, but traditional reports like the COT are too slow. For day trading, use real-time sentiment as a general bias and rely on 1-minute or 5-minute price action patterns for your actual entries.
Does sentiment always lead the price?
Not always. It's a feedback loop. Sentiment drives the price, but as the price moves, it changes how people feel. For example, a sudden price crash will create fear, which then fuels more selling. The key is to find the moments where sentiment is disconnected from the price-that's where the most profit is made.
What is the best tool for monitoring market sentiment?
For a broad view, the VIX is the gold standard for fear. For specific asset positioning, the COT reports are unbeatable. For a more modern approach, many traders use AI-powered sentiment tools that scan millions of news articles and social posts in real-time to gauge the immediate mood.
Why do some professional traders hate sentiment indicators?
Critics, like Al Brooks, argue that price action already includes all the sentiment data you need. They believe that if a price is going up, the "sentiment" is bullish by definition, and any external indicator is just a lagging version of what the chart is already telling you.
Final Word: Moving Forward
If you're struggling with your win rate, stop trying to find a "perfect" indicator. Instead, start by picking one sentiment tool-like the Put/Call ratio-and one price action pattern-like the Pin Bar. Practice identifying them together. When the sentiment is at an extreme and the price action confirms a reversal, you've found a high-probability trade.
The market isn't a math problem; it's a psychological battle. Price action is the record of that battle, and sentiment is the noise of the combatants. By mastering both, you stop guessing and start executing.
Suvoranjan Mukherjee
Absolutely spot on breakdown! For anyone starting out, remember that combining a confluence of factors-like a Fibonacci retracement level hitting a major support zone while the Put/Call ratio is at a bearish extreme-is where the real magic happens. Stay hungry and keep grinding those charts! 🚀
JERRY ORTEGA
just keep it simple people... overthinking the sentiment often leads to analysis paralysis and you end up missing the move entirely
Bruce Micciulla Agency
honestly this is just basic stuff for anyone who actually knows how the plumbing of the market works because if you think a simple pin bar is going to save you from a liquidity sweep by a central bank you are just dreaming and it is honestly pathetic how many retail traders think they can outsmart the algos with a few lines on a screen
Arlen Medina
Exactly! The US markets are the only ones that actually matter and if you aren't trading the S&P 500 with a hybrid approach you're basically gambling. Get the facts straight or get out of the way!
Robert Coskrey
I find this perspective quite refreshing, and I agree that a systematic approach to both metrics is optimal. Thank you for the detailed explanation!
vijendra pal
totally agree bro!! sentiment is everythinggg 📈🔥 just wait for the crowd to panic and then scoop everything up haha 🤑
Emily 2231
The COT reports are a joke because the elites manipulate the reporting dates to hide their actual positions from the American public while the Fed keeps printing money to crash our purchasing power. Do not trust any index that comes from a centralized entity
Patty Levino
I've found that for beginners, focusing on one thing at a time helps a lot. Maybe start with the price action since it's more visual and then slowly add a sentiment filter once you feel comfortable.
Diana Martín Prieto
That's a great way to put it. I always tell my students that the chart tells you the story, but the sentiment tells you if the story is a lie. Great advice for anyone struggling with their win rate!
Alexandra Lance
Oh look, another 'guide' telling us to trust the VIX 🙄 as if the market isn't just a giant simulation controlled by three guys in a basement in Davos 💅✨
Earnest Mudzengi
VIX is just a distraction man. The real money is in the dark pools where the big boys hedge their gamma exposure before the retail sheep even wake up. It is all a rigged game for the globalists to bleed the patriots dry
Arwyn Keast
Typical American obsession with over-complicating a simple game of supply and demand. The jargon here is excessive; just trade the levels and stop pretending you're a psychologist
Matthew Wright
I wonder if there are any backtesting results that specifically compare the hybrid approach against a pure PA strategy over a 5-year period?? That would be fascinating!
david head
this is a game changer for sure 🙌 love the breakdown
June Coleman
Sure, let's just follow a 'hybrid approach' and ignore the fact that the market is basically a random number generator most of the time. How inspiring!
Susan Payne
It is utterly disgraceful that most traders treat this as a hobby rather than a rigorous intellectual pursuit. The lack of discipline in the retail community is a tragedy of epic proportions.
Suzanne Robitaille
There is something so poetic about the struggle between the cold hard numbers of a chart and the chaotic heat of human emotion. It's like a dance between logic and madness!
Taylor Meadows
You're all just chasing shadows. Most of you will blow your accounts because you lack the internal fortitude to handle a drawdown, regardless of whether you use COT or pin bars. Your failure is inevitable if you don't fix your soul first.
Deepak Prusty
The assertion that sentiment is easier to learn is incorrect. Understanding the correlation between macro-economic shifts and sentiment requires a deep knowledge of monetary policy which takes years, not months.
Evan Borisoff
The institutional framework of the US Treasury ensures that any perceived sentiment shift is merely a reflection of liquidity injections designed to maintain the hegemony of the dollar over the long term while the retail traders fight over pennies in a zero-sum game that is structurally biased against them due to high-frequency trading latency
gladys christine
OMGGGGG this is exactly what I needed today!! Seriously just breathe and trust the process you guys are going to crush it if you just stay consistent and keep your head up!!! No more doubting your skills just go for it!!!